Tuesday, November 11, 2008

State market prescience

Assuming John McCain is declared the inner of Missouri’s electoral votes, Barack Obama will officially win 364-174 (or possibly 365-173 if Omaha’s 1 EV goes to Obama). If you were paying attention to Intrade, you knew that a month ago.

While Intrade did have Missouri and Indiana flipped, both were basically true toss-ups (a word much over-used by lazy people this season) and getting such incredibly close races right is more luck than anything else. Preliminary results show Indiana was decided by 0.96% and Missouri by 0.2%. North Carolina was the only other real toss-up, decided by 0.32%.

At no point during the 4 weeks preceding the election did Intrade’s state electoral markets have Obama winning outside the range of 353 to 375 electoral votes. Also, 49 to 51 states were called correctly every day of those last 4 weeks. Pretty good right?

Well, yes and sort of yes. Let’s take an even longer view. The markets were open for about two years, and they always had at least 41 states called correctly. In some sense, the bulk of the predictions are ‘easy.’ Oklahoma was going Republican (almost for sure). We all ‘knew’ that 2 years ago; the price of the ‘Republican wins Oklahoma’ contract was never below 85. Since a lot of states are like this, that’s how the rest get to be called ‘swing states.’ Here’s a graph of a daily view on how many of the 51 predictions Intraders were ultimately proven right on.


What’s interesting though is how this relatively stable situation can lead to great dynamism in the race. If we translate these predictions to electoral votes, we see that over 100 electoral votes were ‘in play.’
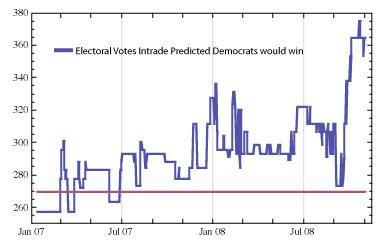


We also see that the Democrat was winning the Electoral College race in Intraders’ minds every day of the last sixteen months. So in some ways it shouldn’t be too surprising that my simulation, taking the dynamics of the state markets as input, came to a position of near certainty well in advance of the election when Obama’s lead became ‘insurmountable.’ Zooming in on the last four months, we see that the dynamics of the electoral markets were such that a McCain victory was all but inconceivable as of early October. This graph shows the simulated chance of Obama victory, as it evolved over the last four months.


Obama’s victory was not inevitable at all though. He nearly did lose. Around 45 days before the election, on the heels of the initial Palin effect, he was definitely in danger of losing. Then came the financial meltdown, McCain’s ‘response,’ and that was all she wrote.

The goals of the simulation model were to be responsive, predictive, and provide a ground-up check on the price of the national Obama & McCain contracts. It was responsive, showing wide dynamic range in immediate reaction to events. And it was predictive, correctly settling on Obama well in advance of the election. As a check on the national contracts, we see there was always something muting the response of the national traders. The national contract moved in a much narrower range in response to events, and the Obama contract never closed above 90. People kept feeling that SOMETHING was going to happen either in the campaign or in the vote-counting. Or maybe all the polls were wrong. Maybe their recent decades of solid performance meant nothing in this case for one reason or another.

The simulated chance of victory is again in blue, with the national-contracts-implied chance of Obama victory in pink.


Well, as is usually the case, this situation turned out to be not so radically unlike all other similar situations in the past. Analytics and modeling had a lot to say. Nate Silver won great acclaim for his ability to cut through the spin and assumptions of the various pollsters in order to come to a true consensus view of the race. Intraders should be equally commended, particularly those that participated in the state markets.

Wednesday, October 22, 2008

How likely is the big upset?

Last time I wrote, I declared that Obama had the election in the bag, according to Intraders participating in the state markets. Since then, Obama's strength has only solidified. For the last two weeks, Intraders have been saying Obama is the more likely candidate to win in states totalling 364 Electoral Votes.

Today, even if we give McCain every state where Intraders have Obama's chances below 80%, Obama still gets 273 votes and wins. In other words, let McCain keep every red state even if it is 51-49. Further, take FL (where Dems are currently trading at 63), MO (at 67), NV (73), NC (58), OH (61), and VA (78) away from Obama and give them to McCain and Obama still wins.

So according to Intrade's state markets there is basically no chance McCain can put together the Electoral Votes he needs to wim. Indeed, my simulation has consistently been putting McCain's chances at well under 1%.

At the time of my last column two weeks ago, the price on the Obama national contract was about 65, and it has since moved to about 85. From a certain perspective, 99%+ seems too high for the chance of almost anything that is two weeks in the future, and you suspect something must be inconsistent. From another perspective, the best a predictor can do is give you an answer with near certainty well in advance of the event. Intraders in the state markets have basically no doubt.

The action then, is in the question of how many electoral votes exactly will each candidate get. Intrade has a collection of markets for that as well, and through the simulation, we can get a good picture of what the state markets have to say on the question. A trader might look at the national price of 85 on 2008.PRES.OBAMA and figure the price of the Obama wins >270 Electoral Votes ought to be close to the same. Further, a trader might see that Obama is “expected” to win 364 Electoral Votes and suspect that the price of Obama winning > 360 Electoral Votes (or McCain winning > 170) ought to be around 50. Indeed, that is about where the Intrade markets on Electoral Vote counts are trading.

But the state markets have more to say than that. I simulate the joint dynamics of the state markets out to election day and produce a distribution of how many electoral votes each candidate ultimately may win. We can compare that distribution (in pink) vs. the Intrade Electoral Vote Count Markets (in blue), for the Democrat:

And for the McCain, again my results from state markets in pink and Intrade's Elecotral College vote count markets for the Republican in blue:

Fundamentally, the state markets are saying something different than the national markets and the electoral count markets. The state markets are actually implying a quite well-settled race at this point (not much can happen that will actually swing a lot of electoral votes). In the price of the national contracts and in the distribution implied by the electoral count markets, we see that Intraders still demand a significant risk premium for the suspicion that something big may yet happen.

Monday, October 6, 2008

It's in the bag

In my last column, I said there is a >95% chance that if the next month goes more or less like the last three months, Intrade's electoral markets on Election Day will be predicting a victory for Barack Obama. Does Obama really have a >95% chance of actually winning the election?

He may not be far off.

Obama won the Democratic primary largely by working the rules of the contest. He needed delegates in that case, and his team put together a very targeted strategy to get them. Now, he needs electoral votes and he has done the same thing. While his lead in the popular vote is small to moderate, his lead in the Electoral College is actually dominant and very unlikely to be turned.

As of Monday afternoon, Intraders give Obama the edge in states carrying 338 electoral votes. He could lose 69 of those and still win. For example Intrade has FL, VA, OH, NV as the most vulnerable blue states right now.

They could all turn red and Obama still wins.

Intrade markets are historically 100% predictive in US elections when the prices are higher than 70 or lower than 30. If we take the states currently in that range, and add in Colorado, which is at 69 for Obama, we get 44 states that, given the level of volatility and the time left, are unlikely to turn. From those states, Obama controls 273 electoral votes to 163 for McCain (Karl Rove himself pointed this out today).

As Obama needs 269 to win, barring something radical, Obama has it in the bag.

And by the way: of the other 7 states, Obama leads in electoral votes 65-37.

Now, by something radical, I don't mean William Ayers. I mean something with a bigger effect on this race than the financial crisis. The recent past has actually been extremely volatile but has led to a relatively settled situation – I don't foresee a huge upswing in volatility between now and Nov 4th .

I have been using my simulation to jointly project Intrade's state electoral market prices forward to Election Day, then assuming Intrade would perfectly predict each state on Election Day. I have made an acknowledgment that there may be some fallibility in the markets when the price is between 30 and 70. In those cases, I now award the state with a probability matching the projected Election Day prices.

In bottom line terms, that will give the underdog a little more chance to win close states. Given the current landscape, that will help McCain more. Even so, I still see Obama having close to a 97% chance of victory.

Yet the individual market for Obama to win the presidency continues to trade around 65. Is there an arbitrage here? What is the real probability of Obama winning at this point? Let's look at other sources that claim to tell us this. Fivethirtyeight.com is a well-known site that works with polling data in a very detailed and sophisticated way. They assign an 87% chance to Obama victory. Election-Projection.net is a similar idea, and assigns a 96% chance. Independent oddsmakers give Obama a 74%-80% chance. If the future is more volatile or more correlated than the past, or if Intrade markets aren't well described by a Gaussian copula, my estimate of 97 may be a few points high, but I am fairly confident 65 is low.

Disclosure: I don't own any of the above securities.

Friday, October 3, 2008

Update

Back in August, it was arguable who was winning the race for president. Unsatisfied with polls-based approaches for a variety of reasons, I turned to the Intrade markets. There are two metrics you can look at to see who traders think is winning at any given time. One is the relative prices of "Obama to win 2008 US Presidential Election" vs. "McCain to win 2008 US Presidential Election." The other is the number of electoral votes Obama and McCain are each expected to win.

Let's focus first on the overall chance of winning. If we look at the relative price metric over the past couple months, we see that Barack Obama has been winning consistently by on average 60/40 except for a brief period in mid-September. For convenience, I'll express the metric as Obama / (Obama + McCain). This is the pink line in figure 1.

In my previous column, I described a system for simulating the joint dynamics of the 51 electoral markets on Intrade forward to Election Day. One can extract from this, what is the probability of Intrade's state market prices on November 4th predicting an Obama electoral victory. That is the blue line in figure 1. In principle, the blue line and the pink line should be roughly the same if you accept the big assumption that the next month may be similar (in volatility and state-to-state correlation) to the last 3 months. As you can see, the simulation has much greater dynamic range than the simple "X to win 2008 US Presidential Election" contracts. The markets react sharply, and this metric reflects that without delay.


Is it credible to say that Obama has a >95% chance of winning the real-world election? He does have a very big lead and there’s not that much time left. But the overall Obama wins the election contract is trading below 70. I will address that in some detail in my next column, but what this really says is there may be significant trading opportunities between the national contracts, the state contracts, and the weekly options.

The other metric we can look at is the expected number of electoral votes for Obama (or McCain). In figure 2, in pink, we see the history of the Intrade electoral vote predictor for Obama, which assigns each state's votes depending on who's contract has the higher price that day. In figure 2, in blue, we see the mean of Obama's electoral votes from my simulation. Typically, these two lines are quite close, which is a good validation of the simulation. The gap is indicative of the predicted average net effect of states flipping from their current status between the measurement date and Election Day. Since the simulated mean is usually below the electoral vote predictor, Intrade's state market traders are implying Obama's lead is a little soft. But the reason the simulation still produces a predicted win for Obama >95% of the time going forward from today is that he does have a really formidable lead in the Intrade state markets.


Friday, September 26, 2008

Intrade state-by-state joint dynamics

There is a wealth of available information on the presidential race -- national and sate polls; poll aggregators like RCP; and meta-analysis like that being done at fivethirtyeight.com and others. And of course there are prediction markets. The Intrade markets on the presidential race (by party or individual) address the question of who is winning directly, but looking to them alone ignores all the information in the state-by-state market prices. And it is the state races, ultimately, that decide the winner.


Investigating the joint dynamics of these 51 individual state markets on Intrade gives a complimentary – and perhaps ultimately the clearest -- picture of how the race is going.


Fundamentally, the problem is similar to risk management of a portfolio. From the candidate's viewpoint, they have a portfolio of 51 binary pay-off assets with fixed weights as determined by each state’s number of electoral votes.


Each state race has a characteristic volatility. And critically, each state is correlated to every other state. These attributes can be empirically determined by Intrade’s historical state-by-state market prices.


Then, we can use the standard technique in portfolio management – to build up a picture of the portfolio dynamics by simulating (out to election day, in this case) correlated series of returns on each individual asset.


By repeating the simulation many times, we get a probability distribution of the expected outcomes. In each simulation, in each state, if the Republican price on Election Day is greater than the Democratic price, the electoral votes are awarded to the Republican, and vice versa.


I’ve run the simulation 5000 times, and found a very interesting distribution of where the electoral vote tally might end up – as implied by the Intrade markets.


As of Sunday September 21, even though national polls are coming in close to 50/50 and Intrade’s contract for Obama to win the Presidency is trading close to 50, Intrade's state-by-state traders implicitly believe Barack Obama has a 76.8% chance of winning at least 269 electoral votes and thus the presidency (I assume a 269-269 tie will be awarded to the Democrat by the new House of Representatives).

How does this fit in with the presidential market prices, which indicate a much closer race? That’s a good question, and I hope to hear some interesting suggestions. Here are some thoughts on:


Obama was winning 273 electoral votes on Intrade on September 21, and so we might expect that to imply a chance only slightly greater than 50% of victory. But Nevada (5 EV), Ohio (20 EV) and Virginia (13 EV) were all less than a 5 point lead for McCain while McCain's likeliest flip was Colorado (9 EV) at 56-44. Because Obama has a better chance of flipping some of the slim McCain leads than McCain does of flipping anything into his column, my simulation’s skewed toward increasing Obama’s total from 273. While 273 is the most likely outcome for Obama’s EV count, the mean was 283.