While Intrade did have Missouri and Indiana flipped, both were basically true toss-ups (a word much over-used by lazy people this season) and getting such incredibly close races right is more luck than anything else. Preliminary results show Indiana was decided by 0.96% and Missouri by 0.2%. North Carolina was the only other real toss-up, decided by 0.32%.
At no point during the 4 weeks preceding the election did Intrade’s state electoral markets have Obama winning outside the range of 353 to 375 electoral votes. Also, 49 to 51 states were called correctly every day of those last 4 weeks. Pretty good right?
Well, yes and sort of yes. Let’s take an even longer view. The markets were open for about two years, and they always had at least 41 states called correctly. In some sense, the bulk of the predictions are ‘easy.’ Oklahoma was going Republican (almost for sure). We all ‘knew’ that 2 years ago; the price of the ‘Republican wins Oklahoma’ contract was never below 85. Since a lot of states are like this, that’s how the rest get to be called ‘swing states.’ Here’s a graph of a daily view on how many of the 51 predictions Intraders were ultimately proven right on.

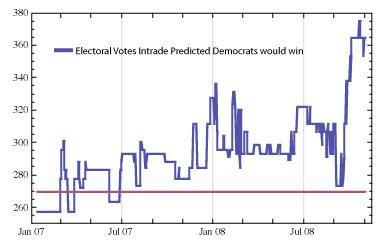
What’s interesting though is how this relatively stable situation can lead to great dynamism in the race. If we translate these predictions to electoral votes, we see that over 100 electoral votes were ‘in play.’

We also see that the Democrat was winning the Electoral College race in Intraders’ minds every day of the last sixteen months. So in some ways it shouldn’t be too surprising that my simulation, taking the dynamics of the state markets as input, came to a position of near certainty well in advance of the election when Obama’s lead became ‘insurmountable.’ Zooming in on the last four months, we see that the dynamics of the electoral markets were such that a McCain victory was all but inconceivable as of early October. This graph shows the simulated chance of Obama victory, as it evolved over the last four months.

Obama’s victory was not inevitable at all though. He nearly did lose. Around 45 days before the election, on the heels of the initial Palin effect, he was definitely in danger of losing. Then came the financial meltdown, McCain’s ‘response,’ and that was all she wrote.
The goals of the simulation model were to be responsive, predictive, and provide a ground-up check on the price of the national Obama & McCain contracts. It was responsive, showing wide dynamic range in immediate reaction to events. And it was predictive, correctly settling on Obama well in advance of the election. As a check on the national contracts, we see there was always something muting the response of the national traders. The national contract moved in a much narrower range in response to events, and the Obama contract never closed above 90. People kept feeling that SOMETHING was going to happen either in the campaign or in the vote-counting. Or maybe all the polls were wrong. Maybe their recent decades of solid performance meant nothing in this case for one reason or another.
The simulated chance of victory is again in blue, with the national-contracts-implied chance of Obama victory in pink.

Well, as is usually the case, this situation turned out to be not so radically unlike all other similar situations in the past. Analytics and modeling had a lot to say. Nate Silver won great acclaim for his ability to cut through the spin and assumptions of the various pollsters in order to come to a true consensus view of the race. Intraders should be equally commended, particularly those that participated in the state markets.
No comments:
Post a Comment